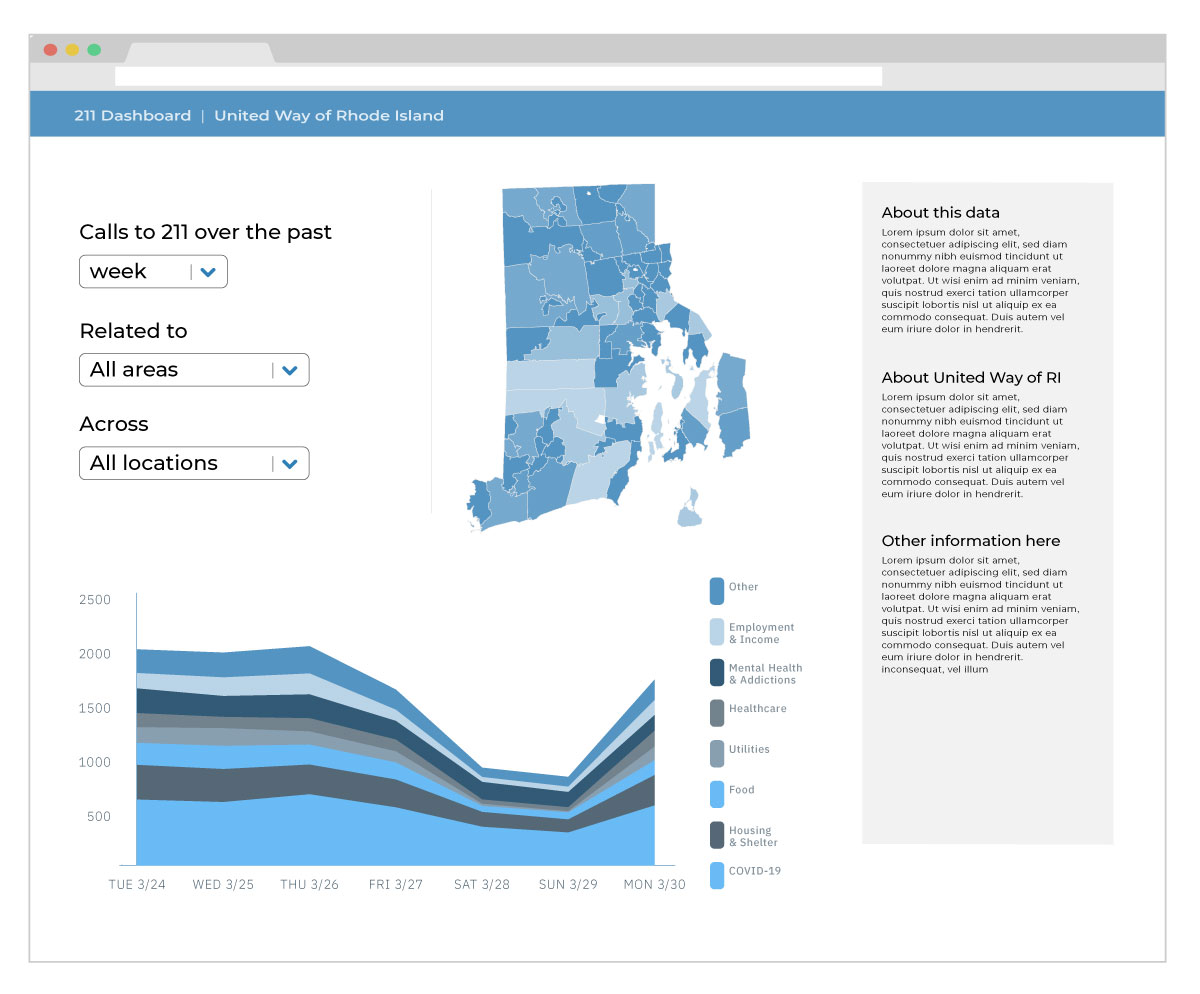
In the previous post post we covered the background and the decisions on what tech stacks we are using for the United Way Rhode Island 211 dashboard. This post will describe how we used Vue.js to build the architecture based on the awesome sketch of Ben Guhin Delphine in the featured image above.
Links to other posts in this series:
- Part 1. Decisions on Tech Stack
- Part 3. Making the Visualizations with d3.js
- Part 4. UI/UX Improvements from User Feedback
- Part 5. Wrangling Data for the App
# The Overall Architecture of the Dashboard App
We chose not to use any backend for this dashboard because neither the volume or the complexity of the data justifies the additional cost of a backend. Another advantage is that the app is essentially "static" with all operations done in the browser, which means a wide range of hosting options to deploy the app, which facilitates the sharing and the deployment of the app.
# Centralized state management in the root component
With Ben's design, it is easy to see that there are two types of the components in this app: the drop-downs on the top left that serve as filters for the 211 call data and the two charts that visualizes the data which change with the filter values. Therefore, in the Vue app, there are two types of states that need to be persisted: the 211 data itself and the filter data. We will load the 211 call data when the app is being initialized. We will also use an object to store the state of the filters, which can be bound to the values of each of the drop-downs. Notably, we can also propagate the options of the drop-downs with the values in the data.
# Propagating down the data through props
Once the 211 data is loaded, it can be passed to the two chart components as props together with the filters. Within each chart component, we can then apply the filters to the 211 data and update the charts. In other words, each component will also maintain a state of its own filtered version of the 211 data. d3.js is well equipped for both the heavy-lifting in processing the data and the rendering of the data visualizations.
# Propagating back data through events
To make the dashboard more interactive, we also need to enable interactions between the two chart components. For example when the users click on one region in the map on the chart, the stacked area chart will also update to focus on the 211 calls in that geographic region. This type of cross-filtering can be done through event propagation: during the rendering of the map, we can use d3 to listen to the click event on each SVG path of the map. Once a click happens, an event can be emitted, which can then be handled by the event handler in the root component of the Vue app. The handler then updates the filter persisted in its state and propagate it to the stack bar chart component, which will reactively update the stacked bar chart. This way, we can combine the powerful event handling in both Vue and d3 to make the two visualizations to talk to each other through centralized state management.
# Building the Skeleton of the App
We began the dashboard app with a project initialized by vue-cli, which comes with a wide range of options in creating a standard Vue app and the type of features (e.g. Vue-Router, Vuex) it will include. It also has a GUI for the same purpose. The Vue Cli website has detailed instructions on how to create a Vue project.
# Loading data files with concurrency
Most of the components in this dashboard app depends on the 211 data: the filter controls need to display all the regions and call categories that exist in the data, not to mention the charts. Therefore, we first need to load the 211 data into the app. This is a fairly large .csv file (approx. 2.5MB) saved in a "tidy(long)" format, which takes some time to load. The file looks like the following, with each line showing a city in Rhode Island, and the number of calls in a specific category on a given date.
city,type,date,count
Barrington,All Categories,2020-03-01,0
Barrington,COVID-19 Control,2020-03-01,0
Barrington,Disaster Services,2020-03-01,0
Barrington,Food/Meals,2020-03-01,0
Barrington,Health Care,2020-03-01,0
There are also a couple of other data files that needs to be loaded: a geojson file that provides the city outlines which the map is based on, and a jsonfile that shows the population of each Rhode Island city, which will be used to calculate per 1000 capita number of calls. We can use JavaScript Promises to concurrently load these files to reduce the time of rendering block. The code looks like this:
// We have to make the created() lifecycle method async since we
// are using await ES6 syntax in the body.
async created() {

  let [data, topo, pops] = await Promise.all([
    d3.csv(`/dashboard_data.csv`, row => { // loads the 211 call data
      row.date = new Date(row.date) // convert date column to Date
      return row;
    }),
    d3.json(`/ri.topo.json`), // loads the topojson for the map
    d3.json(`/ri_pops.json`)  // loads the RI city population file
  ])

  // More operations based on the data from here ...
}
A few observations on the above code:
- Data loading happens in the
created()lifecycle method of the root component, which means the data will be loaded when the root component is being created. We can make this methodasyncbecause we are usingawaitin the function body. - In d3 v5, data loading methods such as
d3.csvandd3.jsonreturnPromises.Promise.all()takes an array ofPromises and returns aPromisethat resolves when all of the promises in the array are resolved. This ensures that each of the function calls in the array is executed concurrently. awaitcan be used with any function that returns aPromise. It blocks the execution of the code until the promise is resolved.- We also used the ES6 array deconstruction syntax to assign the result of
Promise.all()function to individual variable to be referred to later.
# Filter controls with Vue-Formulate
Vue-Formulate is a light-weight library for creating forms in Vue apps. It essentially provides a Vue component wrapper for every HTML form element and provides data binding and easy form validation. We used a <Vue-Formulate> component for each of the drop-downs. For example, for the first drop-down:
<FormulateInput
  type="select"
  label="Calls to 211 Over the Past"
  v-model="options.range"
  :options="{Week: 'Week', Month: 'Month', 'Select Dates': 'Select Dates'}"
  @input="handleRangeChange"
/>
Note that we wrote an event handler for when the value changes in the drop-down. With vanilla html select element, this event is v-on:change, but for Vue-Formulate, this event is v-on:input. The use of @ is simply a shorthand to replace v- prefix in Vue.
# Next up:
In this post we covered the overall architecture of the dashboard app and a few details in creating an outline of the app. In the next post, we will describe how we made the data visualizations.